Wireshark To Capture, Filter And Inspect Packages
Wireshark is a network analysis tool formerly called Ethereal, captures the packets in real time and displays them in a human-readable format. Wireshark includes filters, color codes and other features that allow you to thoroughly examine network traffic and inspect individual packages.
This tutorial will familiarize you with the basics of packet capture, filtering, and inspection. You can use Wireshark to inspect network traffic for a suspicious program, analyze traffic flow on your network, or troubleshoot network problems.
Get Wireshark
You can download Wireshark for Windows or MacOS from its official website. If you are using Linux or another UNIX system, you will probably find Wireshark in its package repositories. For example, if you use Ubuntu, you will find Wireshark in the Ubuntu Software Center.
Just a little warning: Many organizations do not allow Wireshark and similar tools on their networks. Do not use this tool at work unless you have permission.
Packet capture
After you download and install Wireshark, you can launch it and double-click the name of a network interface under Capture to start capturing the packets on that interface. For example, if you want to capture traffic on your wireless network, click your wireless interface. You can configure advanced features by clicking Capture> Options, but this is not necessary at this time.
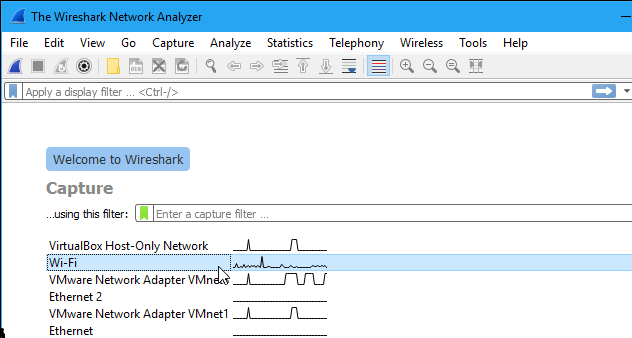
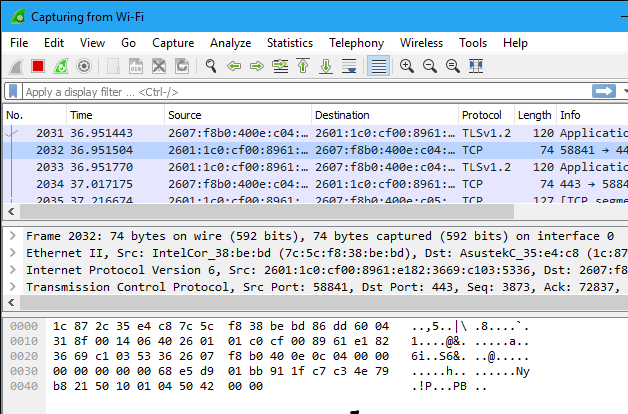
As soon as you click on the name of the interface, you will see that the packages start to appear in real time. Wireshark captures each packet sent to or from your system.
If promiscuous mode is enabled, it is enabled by default. You will also see all other packets on the network instead of only packets addressed to your network card. To check if promiscuous mode is enabled, click Capture> Options and verify that the “Enable promiscuous mode on all interfaces” checkbox is selected at the bottom of this window.
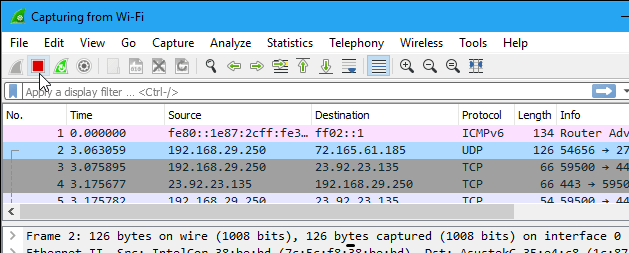
Click the red “Stop” button in the upper left corner of the window when you want to stop capturing the traffic.
Color code
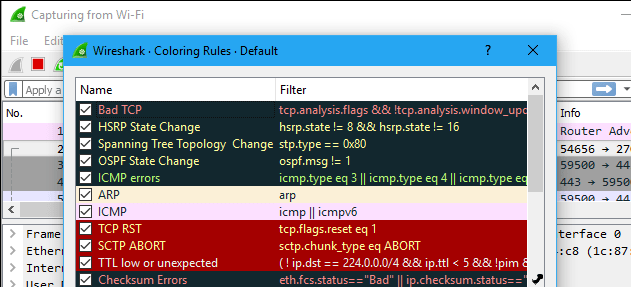
You will probably see packages highlighted in a variety of different colors. Wireshark uses colors to help you identify types of traffic at a glance. By default, light purple is TCP traffic, light blue is UDP traffic, and black identifies packets with errors, for example, they may have been delivered out of order.
To see the exact meaning of the color codes, click View> Color Rules. You can also customize and change the staining rules from here if you wish.
Capture samples
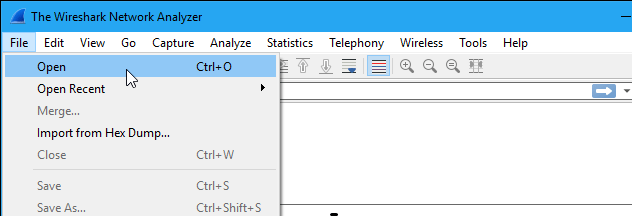
If there is nothing interesting about your own network to inspect, the Wireshark wiki covers you. The wiki contains a page of sample capture files that you can load and inspect. Click File> Open in Wireshark and locate the downloaded file to open one.
You can also save your own captures in Wireshark and open them later. Click File> Save to save your captured packets.
Filtering packages
If you are trying to inspect a specific item, such as the traffic a program sends by telephoning home, it is helpful to close all other applications using the network to reduce traffic. However, you will probably have a large number of packages to go through. This is where Wireshark filters come into play.
The easiest way to apply a filter is to type it in the filter area at the top of the window and click Apply (or press Enter). For example, type “DNS” and you will only see the DNS packets. When you start typing, Wireshark will help you automatically complete your filter.

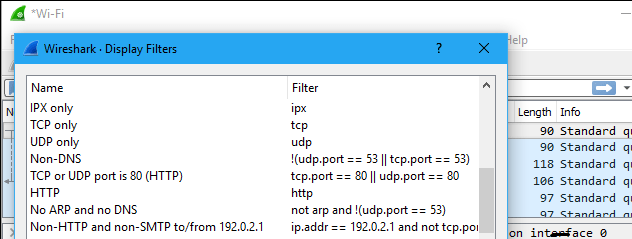
You can also click Analyze> Show Filters to choose a filter from the default filters included in Wireshark. From there, you can add your own custom filters and save them for easy access in the future.
For more information on the Wireshark display filtering language, read the display filter expression page in the official Wireshark documentation.
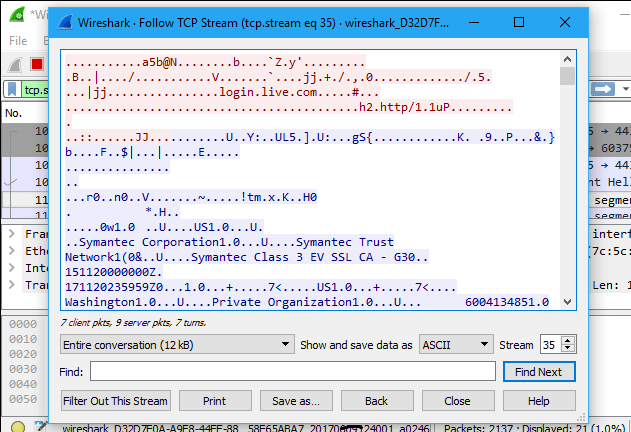
Another interesting thing to do is right-click on a package and select Track> TCP Stream.
You will see the complete TCP conversation between the client and the server. You can also click other protocols in the Follow menu to see complete conversations for other protocols if any.
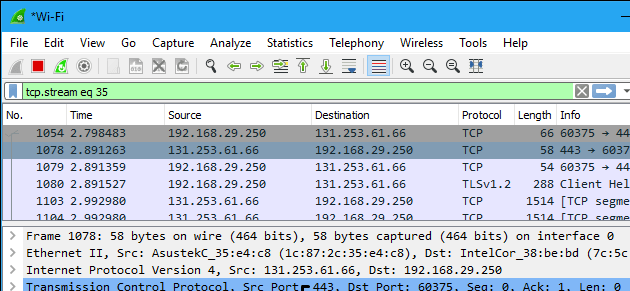
Close the window and you will find that a filter has been applied automatically. Wireshark shows you the packages that make up the conversation.
Packet Inspection
Click on a package to select it and you can dig to see its details.
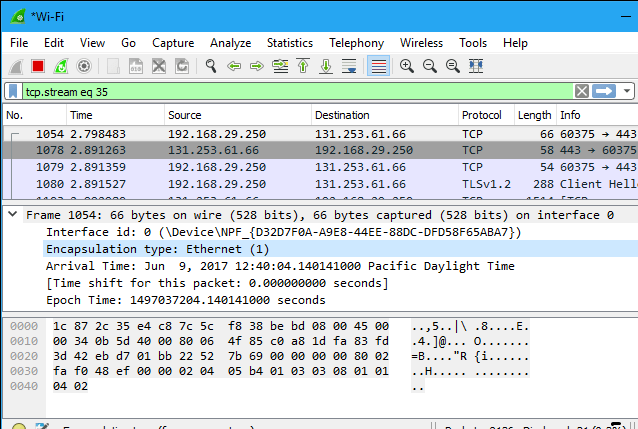
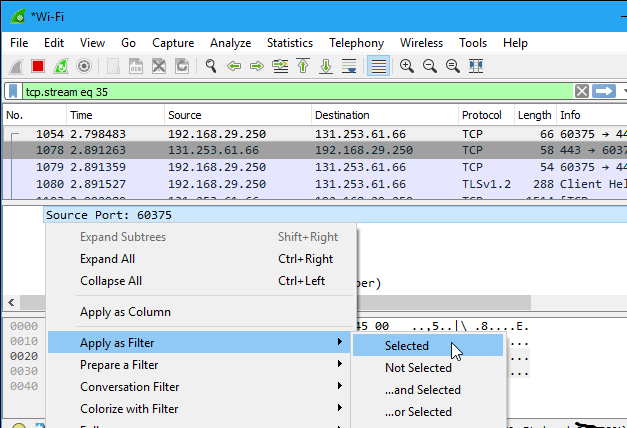
You can also create filters from here – right-click on any of the details and use the Apply As Filter sub-menu to create a filter based on it.
Wireshark is an extremely powerful tool, and this tutorial only scratches the surface of what you can do with it. Professionals use it to debug network protocol implementations, examine security issues, and inspect network protocol internal components.


hi, Nice
ReplyDeleteWireshark To Capture, Filter And Inspect Packages ~ Web Testing And Software Testing >>>>> Download Now
Delete>>>>> Download Full
Wireshark To Capture, Filter And Inspect Packages ~ Web Testing And Software Testing >>>>> Download LINK
>>>>> Download Now
Wireshark To Capture, Filter And Inspect Packages ~ Web Testing And Software Testing >>>>> Download Full
>>>>> Download LINK 5M
Wireshark To Capture, Filter And Inspect Packages ~ Web Testing And Software Testing >>>>> Download Now
ReplyDelete>>>>> Download Full
Wireshark To Capture, Filter And Inspect Packages ~ Web Testing And Software Testing >>>>> Download LINK
>>>>> Download Now
Wireshark To Capture, Filter And Inspect Packages ~ Web Testing And Software Testing >>>>> Download Full
>>>>> Download LINK